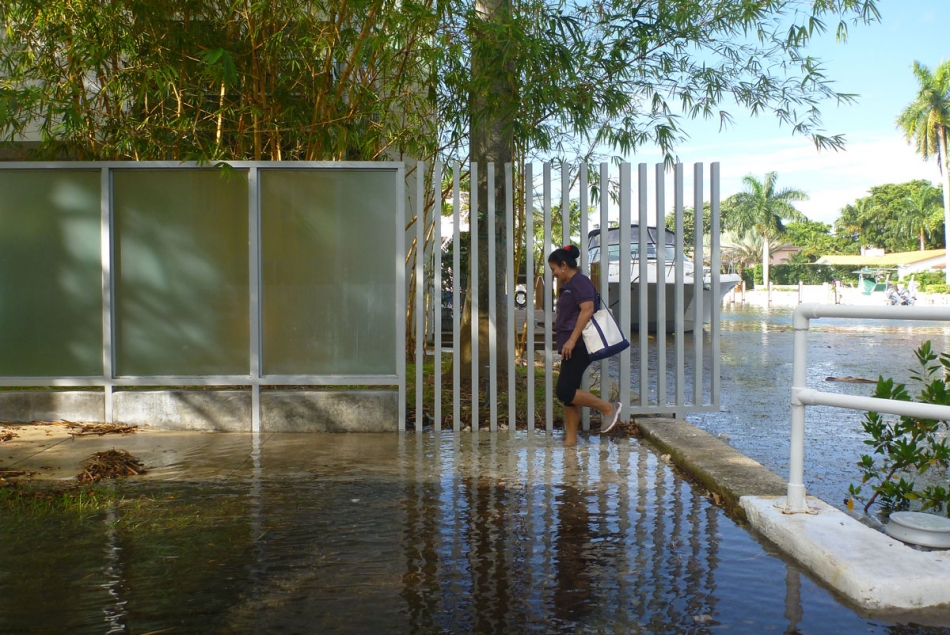
One morning last October, Miami’s municipal government issued a warning to drivers in the area: they should avoid much of the city’s center, because it had been inundated. “Today, Miami is flooding as if a hurricane went through it,” the city’s mayor wrote on Twitter.
No hurricane had hit Miami that week. The flooding was the result of a “king tide” — an especially intense high tide brought about by a particular alignment of the moon and sun that usually occurs in the fall and winter. Rain and wind had amplified the tide’s effects.

Minor floods, and the damage and disruption they cause, have grown far more common in the last few decades. As sea levels rise thanks to human-caused climate change and other factors, these floods will become more common still.
Many minor floods are a matter of inches rather than feet, but some — like last October’s in Miami — are deep enough to disrupt traffic and other systems. Even a few inches of water in the basements or ground floors of homes and businesses can ruin floors, furnishings, and other possessions, requiring extensive cleanup.
Over time, the damage adds up. Standing water can weaken infrastructure. The sea level rise that underlays flooding can increase the salinity of coastal soils, degrade water quality, and make it harder for crops to grow.
From 2005 to 2015, the median annual frequency of flooding days more than doubled along the stretch of coast from Florida to North Carolina, according to an analysis by scientists at the National Oceanic and Atmospheric Administration (NOAA). The coast between Virginia and Maine saw a median increase of 75 percent during the same period. (The trend was more limited on the West Coast, in part because of the region’s coastal topography, ocean currents, and the uneven distribution of sea level rise around the world.)
Further increases are likely coming. In an average year this decade, 30 sites selected by Climate Central saw a total of 153 days of floods, according to data from NOAA. (Sites were selected based on geographical representation and data availability.) In an average year in the 2040s, those 30 locations would see around 2,850 floods. In the 2070s, the numbers would be higher still, at 8,873. While flood counts for future decades include the effects of sea-level rise and high tides, flood counts for past and present decades are also shaped by storm surges. These projections assume a sea-level rise of 3.3 feet over the course of the century — what NOAA calls an “intermediate” scenario.
The United States seems set for a major increase in minor flooding.
Higher High Water
As the moon orbits the Earth, its gravity tugs on the oceans, making the tides ebb and flow. When the moon and the sun align, they compound each other’s pull, producing higher tides than usual. That happens about every two weeks.
In the late fall and early winter, the Earth is closer to the sun than it is during the rest of the year, making the biweekly high tides even higher. These “king tides” are shaped not just by solar and lunar gravity but also by local factors, from rainfall and water temperatures to coastal topography and ocean currents, such as the Gulf Stream. On the East Coast and Gulf Coast of the United States, the peak tide comes between September and November. On the U.S. West Coast, it’s between November and February.
How many floods will those months see in the years ahead? To visualize changes in flooding rates, Climate Central counted the number of floods occurring or projected to occur in two separate months in recent and future decades — October for sites on the East and Gulf Coasts, and December for sites on the West Coast. Past and present flood counts were based on simple observations from tide gauge records of days when water levels exceeded what NOAA calls the “minor flood threshold.” Totals include floods of any size above this threshold, caused by any combination of factors, such as sea level rise, tides, and storm surge. Projected flood counts, on the other hand, factor in only projected sea-level rise and tides, and are thus biased low. The sea level projections assumed a high emissions scenario. NOAA has developed definitions of minor flooding thresholds that vary by location. Those thresholds, used here, often lie around 1.6 feet above the average water level at high tide — a point at which, in many places, water levels start to cause problems for local infrastructure.
The increases in flooding — mostly minor flooding — that the United States has recently experienced are due in large part to climate change. Without the higher sea levels produced by our warming climate, 76 percent of the coastal flood days that occurred at 27 locations across the continental United States between 2005 and 2014 would not have happened, an earlier report by Climate Central found. Warming, in turn, is the result of emissions of carbon dioxide and other heat-trapping gases.
Global mean sea levels have risen by more than 7 inches since 1900. Greenhouse-gas emissions have already locked in more than five feet of further sea level rise, although the rate at which that rise will occur is less clear. More greenhouse-gas emissions will drive sea levels higher still. (Some non-climatic factors, such as subsidence — the slow-moving, vertical motion of the land with respect to the sea — add to or subtract from the total amount of sea level rise locally.)
As the saying popularized by Margaret Davidson, a former director at NOAA, puts it, today’s floods are tomorrow’s high tide.


